The AI logs screen
Which AI crawlers hit your site, what they got, and how a real bot is told apart from a spoofed user agent.
What this screen is for
AI logs counts robots. Each time GPTBot, ClaudeBot, PerplexityBot or another tracked crawler asks your site for a page, the request lands here with the path it asked for, the status your server returned, and the moment it happened.
It is not the AI Traffic screen, and this is the confusion worth clearing first. AI logs counts machines reading your pages. AI Traffic counts humans landing on them after an assistant pointed them at you. A page can be crawled a hundred times without one person ever arriving on it, and the two screens are wired to different sources. If you are looking for people rather than robots, go to AI Traffic.
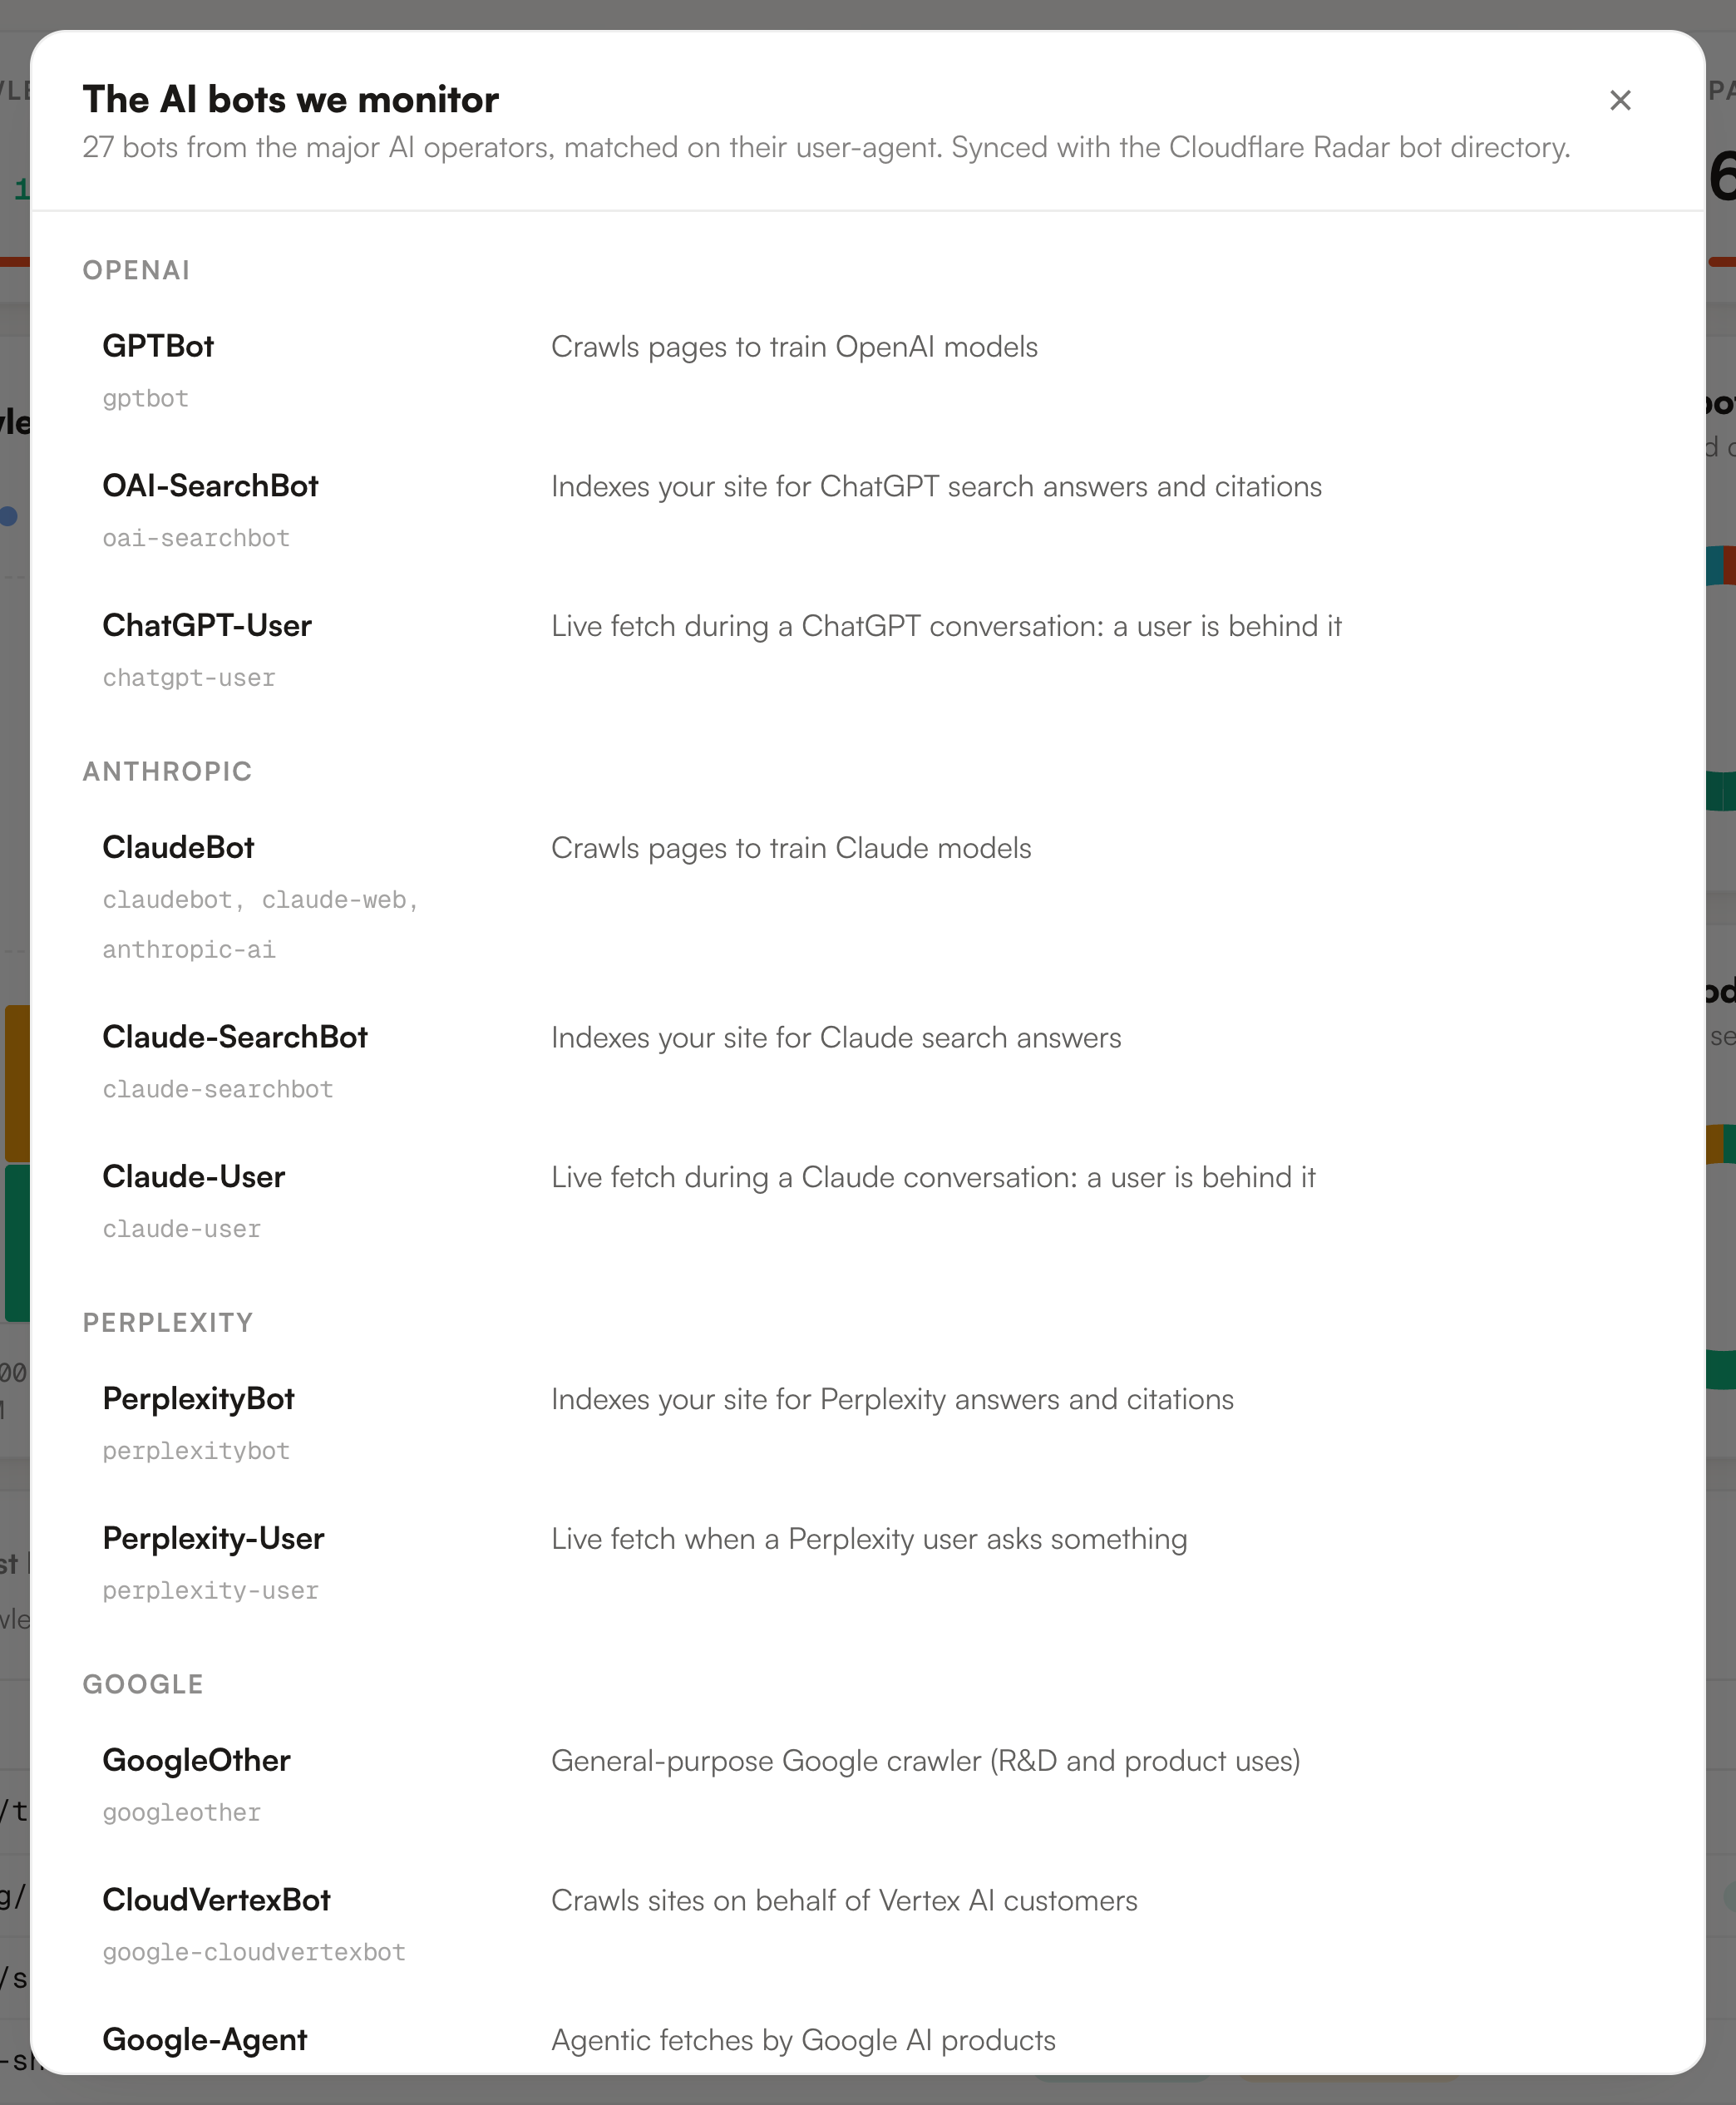
The directory is closed and it holds 27 bots from 18 operators. Each one is matched on a fragment of the user agent string the request carries. The question mark next to Hits by bot opens the full list: operator, what the bot is for, and the fragments that trigger the match. Several strings can point at the same bot, which is why ClaudeBot covers claudebot, claude-web and anthropic-ai.
What you see
The screen opens on today, which draws one bar per hour. Today, Yesterday, 7d and 30d are one click away, and the date picker takes any custom range up to 365 days.
Three counters sit on top. AI crawler hits is the number of requests over the period, with the change against the previous window of the same length. Unique bots is how many distinct crawlers showed up. Pages crawled counts distinct URLs, not requests, so a bot fetching the same page twenty times moves the first number and not the third.
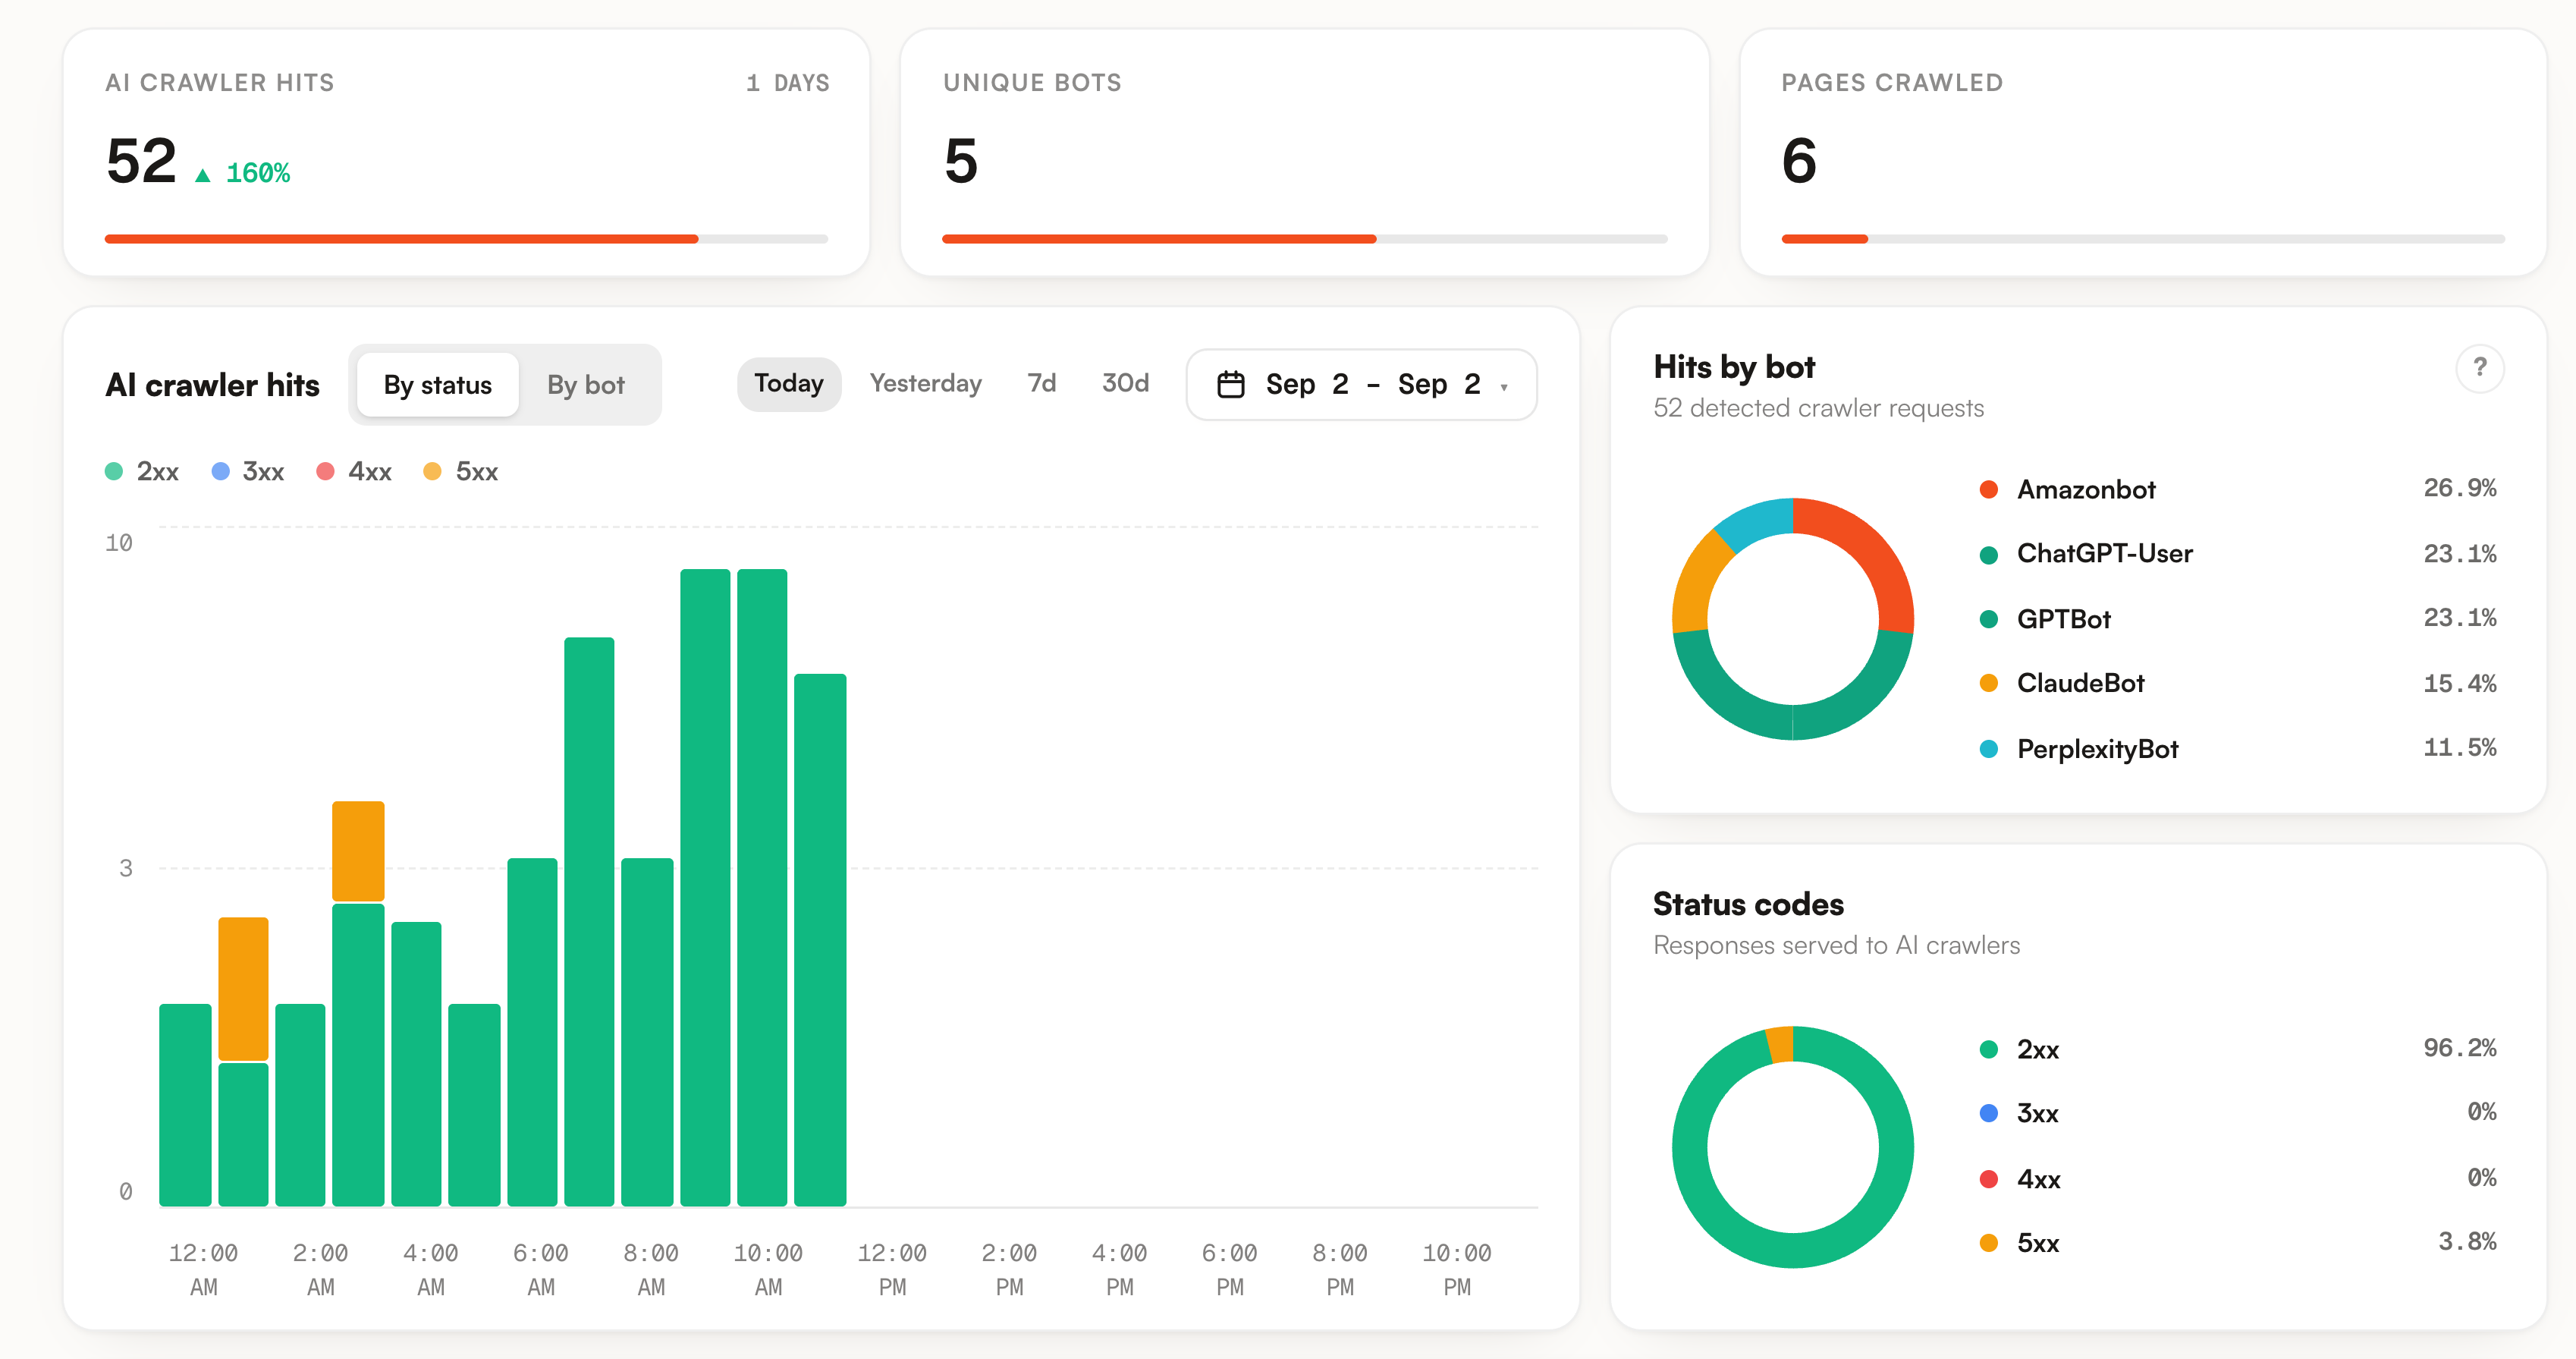
The chart has two readings. By status stacks the day into 2xx, 3xx, 4xx and 5xx. By bot stacks the five busiest crawlers plus an Other segment for the rest. Clicking a legend entry hides that series. The two donuts on the right repeat the same split as shares.
| Status | What the crawler got | How to read it |
|---|---|---|
| 2xx | The page was served. | The normal case. It says the crawler reached the page, not that it liked what it found there. |
| 3xx | A redirect. | Fine in small numbers. Worth checking when a page you want cited answers with a redirect every time. |
| 4xx | The page was refused or missing. | Coloured red on purpose. A crawler asking for a URL that is not there got that URL from somewhere, so each one is worth opening: it can be a page you retired, a link someone got wrong, or an address the model invented. We record the status and the URL, never the reason, so the reading is yours to do. |
| 5xx | Your side failed. | Coloured amber, because it is usually transient. If the same URLs keep failing, the Slow pages tab is the place to look next. |
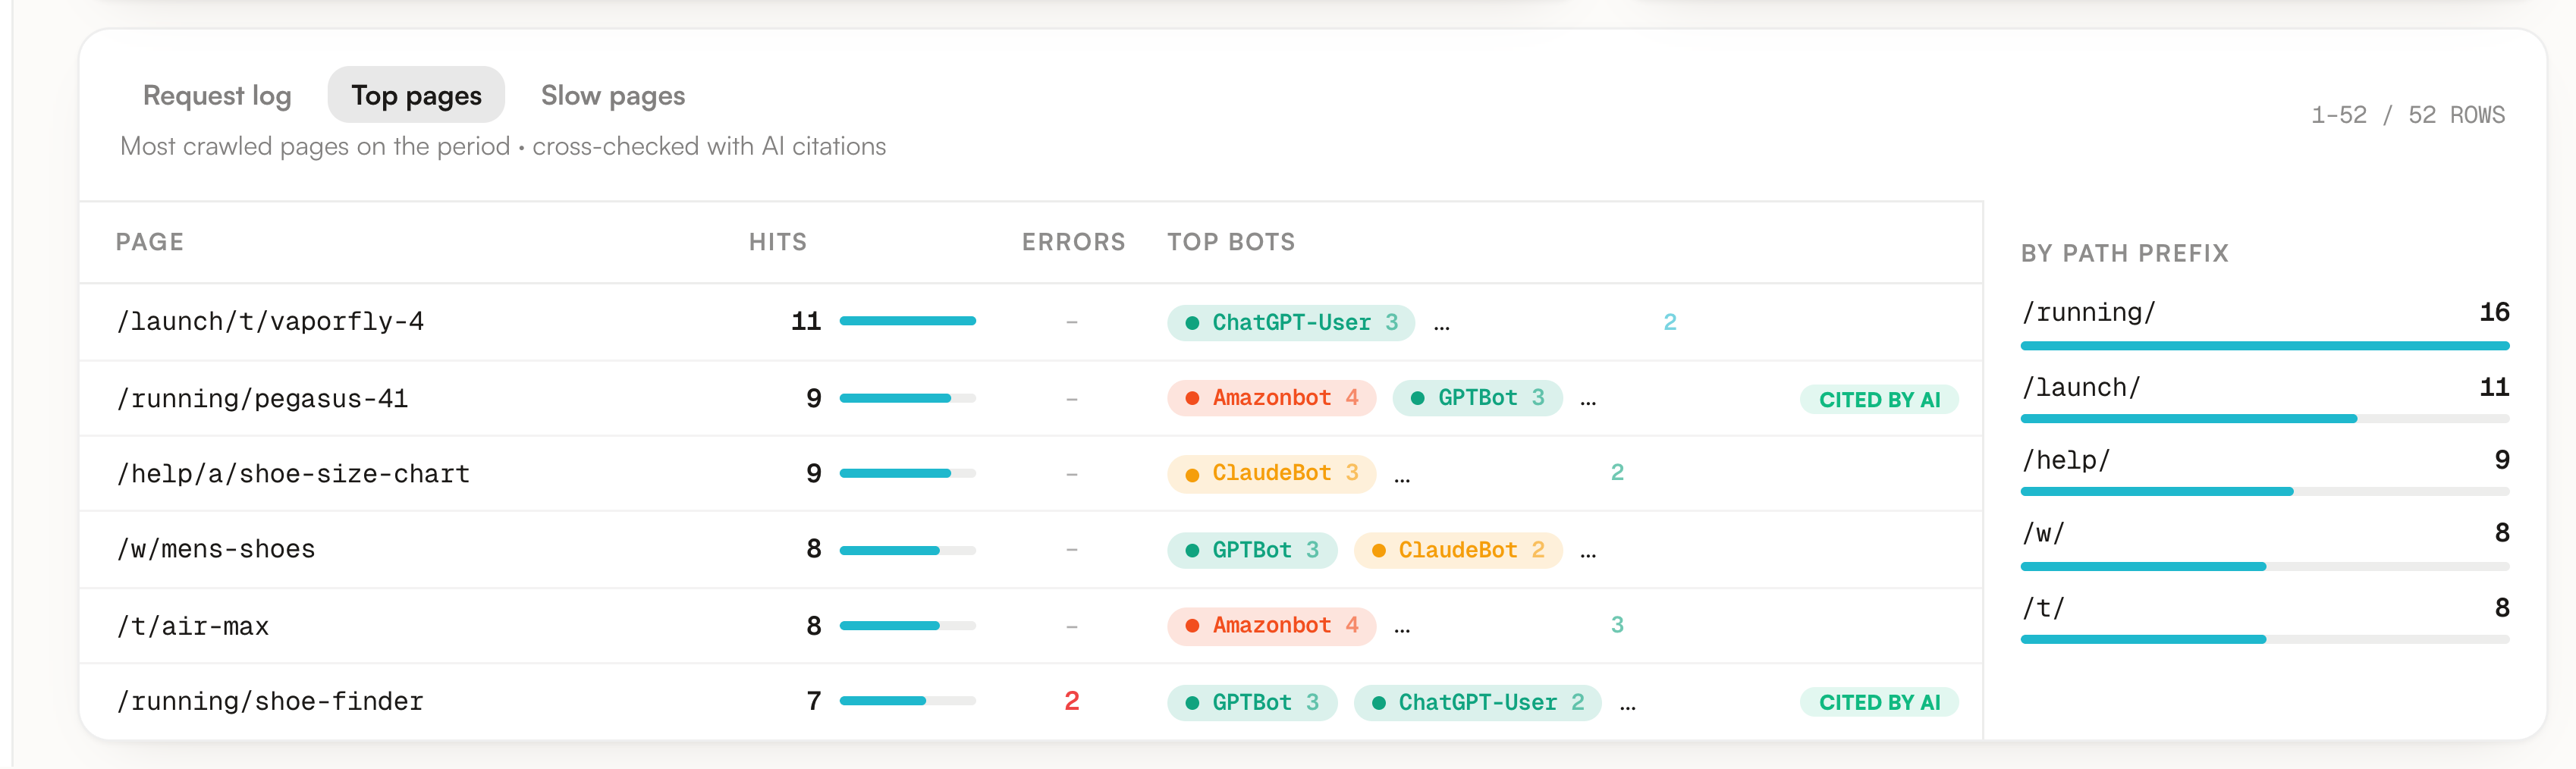
Under the charts, three tabs share one panel. Request log is the raw journal, newest first, 100 rows per page, with the timestamp, the bot, the IP, a country flag, the method, the path, the status, the origin response time and the user agent as it arrived. Top pages ranks the 30 most crawled URLs of the period. Slow pages ranks the 30 slowest URLs to answer a bot.
What you can do
Everything narrows the same journal. Clicking a segment in the chart filters the log on that bot or that status and clears the other filter, so what you read matches exactly what you clicked. The two dropdowns only offer bots and statuses that actually occurred in the period. The search box matches the path, the IP and the user agent. Export CSV streams the journal with the filters applied, over the whole period rather than the page on screen.
Top pages answers a different question: which of your pages the engines keep coming back to. It carries an error count per page, the three busiest bots on it, a breakdown by path prefix, and a Cited by AI badge when that exact URL also appears in the sources the engines cited on your prompts.
Telling a real bot from a spoofed one
A user agent is declarative. It is a string the client writes about itself, and anyone can send a request announcing GPTBot from a laptop. So the Bot column tells you what the request claimed to be. On its own it never tells you who sent it.
When your hits arrive through the Cloudflare Worker, each row carries two extra pieces of evidence that do not come from the user agent.
The chevron at the end of a Request log row opens a small panel with the edge context: network, verified bot, edge location, protocol, TCP round trip and the Cloudflare ray id.
This is the flag Cloudflare attached to the request at the edge. We store it as it arrives and display it, we do not compute it.
It names the autonomous system the request came from. Two hits claiming the same bot from unrelated networks is the pattern to notice, and it is the check to run before you conclude anything from the flag alone.
| CF verified bot | What it means |
|---|---|
| yes | Cloudflare recognised this request as coming from a bot it verifies. The claim in the user agent is backed by something other than the string itself. |
| no | Cloudflare did not recognise it. That covers two very different cases: an impostor borrowing the name, and a genuine crawler Cloudflare does not verify. The network line is what separates them. |
| Empty | No signal at all, shown as a dash. Either the hit came through the server log method, or Cloudflare attached no bot management data to that request. |
Limits worth knowing
Nothing appears on this screen until you connect it. Promptrack does not crawl or probe your site to fill it: the rows are what your own edge or your own server saw. Two methods are offered, and they do not carry the same detail. The setup panel is open by default until the first hit lands, and the Configure logs button brings it back afterwards.
| What you get | Cloudflare Worker | Server logs |
|---|---|---|
| Bot, path, status, method, IP, timestamp | Yes | Yes |
| Country flag, network, edge, protocol, round trip | Yes | No |
| CF verified bot | Yes, when Cloudflare provides it | No |
| Origin response time, and the Slow pages tab | Yes | No |
The server log method has three edges of its own. Each upload is capped at 2 MB and the first 10,000 lines, so an hourly cron is safer than a daily one on a busy site. Lines older than 24 hours are skipped, which keeps a first upload from redrawing weeks of history at once. And the parser expects the default combined format, with the user agent as the last quoted field on the line, and it reads GET, POST and HEAD lines only. Anything else is skipped without a warning.
Two more numbers are worth carrying. Top pages and Slow pages are computed on a five minute cache, so they can lag the Request log by a few minutes right after a burst. Slow pages needs at least three hits on a URL before it ranks it, which keeps one freak request out of the table.
The Cited by AI badge reads the 100 most recent analyzed results of the project and matches on host, path and query, ignoring a leading www and a trailing slash. A page cited in an older run, or cited under a URL that differs by one parameter, will not carry the badge. Its absence is not evidence that the page is never cited.
Where to go next
A crawl is the start of the chain, not the end of it. Three screens continue it.
AI Traffic is the other half of this screen: the humans an assistant actually sent you, which needs the JavaScript snippet rather than the Worker. The site audit answers the question this screen raises when a bot is missing entirely, which is whether it is allowed in and whether your pages hold anything to read on arrival. The action plan picks up the errors found here and ranks them against everything else waiting for your attention.